

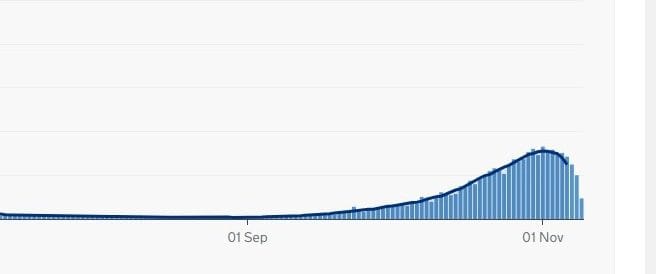
This week has seen a drop-off in new confirmed cases nationwide.
The pattern is shown in the graph above which shows the number of new cases according to the date the test was made. Readers should note that this is different to the statistics usually reported by the BBC, which relate to the date cases were reported, which can be quite different to the date they actually occurred, and invariably shows as a higher figure.
The latest confirmed figures relate to November 8 and show new cases on that date to be down to 12,878. Late reporting may cause an increase in this figure, but any increase is likely to be marginal and will still show a significant fall in numbers.
Much the same applies to deaths where Covid-19 is mentioned on the death certificate (but not necessarily where death was caused by Covid-19). Here, the latest date for confirmed figures is November 6 when there were 285 deaths actually recorded for that day. Once more, a significant decrease from the maximum of 331 at the beginning of the month.
For the Rother area, conversely we are seeing an increase in both new cases and deaths.
New cases for the week October 31/November 6 were reported as 61, an increase of 22 over the previous week. This equates to 65 cases per 100,000 of the population. The national average in England is 177.
The national figures are taken from the government website and, as stated above, relate to the precise date a positive test was taken or death occurred. The local figures were supplied to the BBC (and the government) by the NHS and public health authorities and relate to reported cases and deaths. These are therefore less accurate and likely to be slightly overstated.


